
Eight SEO data APIs, wired into one running system.
We built ConceptSEO, a platform that audits sites every week and implements most of the fixes itself, and every one of its inputs is somebody else's API. This is the field report: which integrations earn their keep, which ones return something that looks like data and is not, and the specific failures that cost us days and appear in nobody's documentation. If you are deciding whether to build SEO tooling in-house, the reading order is roughly worst-surprise-first.
Scope, so the rest reads correctly: everything below comes from one system running against 17 connected domains, and every figure is either read off that system or off a page already published on this site with its window stated. Where a number would have to be estimated, the behavior is described without one. Nothing here is a review of tools we have not run.
Which APIs does an SEO product actually need?
Fewer than the market suggests, and none of the expensive ones. The set that ended up load-bearing is Google Search Console for query and page data plus URL inspection, PageSpeed Insights for lab metrics, Chrome UX Report for field metrics, Google Ads Keyword Planner and Bing Webmaster Tools for keyword volume, Cloudflare's GraphQL analytics for what actually arrives at the edge, GA4 for behavior, and Open PageRank for a free authority proxy.
Yandex Webmaster is wired for one domain with a Russian-speaking audience. IndexNow is a push rather than a read.
That is eight read integrations carrying the whole product across 17 domains, and the recurring data cost is zero. Every one of them is free at our volume.
The two we expected to need and did not are a paid rank tracker, because Search Console already reports position per query per page, and a backlink index, for a reason worth its own section below.
What does the Search Console API give you that the UI does not?
Row-level joins the interface will not do, and the ability to ask the same question every day without a human. The Search Analytics endpoint returns query and page as dimensions you can request together and filter on, so "which URL does Google actually rank for this term" is one call rather than a session of clicking.
That single capability is what turned keyword cannibalization from a theory into a check: pull the ranking page per query per day, and a query where Google rotated between two of your own URLs across the window is visible as data.
Three things about it will mislead you, and all three cost us real time.
A property holds nothing from before its own verification date. Google backfills none of it. A window that predates verification returns zero rows, which is indistinguishable in the response from a site that lost all its traffic. On one client domain, --days=7, --days=28, --days=90 and --days=365 all returned the identical 519 rows and 4,451 impressions, because the domain property had been verified about ten days earlier and the data simply ended. The site's real history was sitting in an older URL-prefix property, which held 47,839 impressions in January. Read naively that is a 99 percent collapse. It was a property boundary.
The tell is cheap: if widening the window does not change the numbers, the data ends there. Two probes settle it, a one-day request that should shrink and one explicit older month that should come back empty or not.
A domain property aggregates every subdomain, one way.sc-domain:example.com includes blog.example.com and seo.example.com; the subdomain's own property does not include the apex. That asymmetry is easy to miss and it silently merges two websites. On this estate it meant one site's keyword table was 92 percent another site's rows before we caught it, and every analysis built on top described the wrong website.
The query dimension omits anonymized low-volume queries. Summing query rows therefore lands under the page-level or total figure, always.
That is correct behavior and it is not documented anywhere near where you will look for it, so never reconcile a query export against a totals export and never treat the gap as a bug. The official reference for the endpoint is Google's Search Analytics: query documentation.
Why does PageSpeed Insights time out, and what do you do about it?
Because it runs a real Lighthouse pass before it answers, so the round trip scales with how heavy the page is rather than with anything on your side. Measured from production on 21 August 2026 with our own four-category query:
| Target | Mobile | Desktop |
|---|---|---|
| A small static site | ~8s | — |
| A JavaScript-heavy app | 89–113s | HTTP 500 after 60–180s |
Our service was calling it with a 45-second timeout, which is a reasonable-looking number and is below the floor for an entire class of site. Every JS-heavy target was cut off and recorded a permanent n/a while the API and the key were working perfectly. Two sites sat like that until somebody measured instead of assuming.
Two rules came out of it and both are now encoded in the service. Never retry a connection timeout. A slow Lighthouse pass is slow every time, so a retry buys nothing and spends another full timeout window.
And budget retries on wall clock rather than attempt count: a transient 429 or 502 comes back in about two seconds and deserves its retries, while a 500 that took 90 seconds is Lighthouse choking on the page and will choke again. At a 150-second timeout, three of those would eat most of a ten-minute job budget.
There is also a diagnostic trap here that sent us down a dead end for most of a morning. A keyless PSI call returns 429 with quota_limit_value: "0", which reads exactly like an exhausted daily allowance. We were reading the wrong environment variable name, so the key was empty, so the response looked like quota exhaustion on an account using roughly 38 calls a day against an allowance of 25,000.
Check the key is actually being sent before you believe a quota error. The endpoint's own limits are in the PageSpeed Insights API documentation.
Lastly, the lab-versus-field distinction is not academic and it decides whether you touch code. Lab numbers on this estate swing by a factor of five between runs on the same static page.
Field data from the Chrome UX Report is what real Chrome users experienced, and it is the number worth acting on. We treat lab layout-shift readings in particular as a hypothesis, never a finding.
Which keyword-volume sources are worth the integration?
Google Ads Keyword Planner, if you can get access to it, and Bing Webmaster Tools as the fallback that costs nothing to add.
Keyword Planner's historical metrics endpoint returns volume and competition for terms Search Console already told you the site ranks for, which is the join that matters: it stops a content pipeline from recommending a page for a term nobody searches. Bing's keyword stats fills in thin volume for niche terms where Google returns nothing at all.
Two things worth knowing before you plan around it. Volume figures are bucketed and move between runs, so treat them as an order of magnitude rather than a measurement, and never present them next to a Search Console impression count as though they were the same kind of number.
And Keyword Planner access is an account problem rather than an engineering one: it needs a Google Ads account with at least basic API access, and the token that authorizes it is the part most likely to break your pipeline a year later.
That last point is a real durability caveat and not a hypothetical, so we will state it plainly about our own system: our Keyword Planner access runs on a personal Google refresh token rather than a dedicated service account, and if that account is ever disconnected, volume degrades to the Bing figures.
The whole path is wrapped so a cold cache, a missing table or absent credentials changes nothing about what the analysis says. That degradation design is worth more than the data.
What breaks in production that the docs do not mention?
The pattern behind almost every one of these is the same, and it is the thing to internalize if you take nothing else from this page: an unmeasured value and a measured zero are indistinguishable once they are written to a column, and every downstream consumer will read the zero.
Our Bing backlink fetch had been broken since the day it shipped. It built its site URL from a field holding Search Console's domain-property format, sc-domain:example.com, which has no scheme, so a str_starts_with($url, 'http') check failed and the value became https://sc-domain:example.com. Bing rejected it. The failure was recorded as total_backlinks = 0, the freshness checker then read the recent row as fresh, and the analysis gated on a count greater than zero and simply omitted the section. That produced 53 monthly snapshots of zeros with no error logged anywhere. The fix was one line. Finding it took a question nobody had asked in a year.
The column now records whether a fetch succeeded, was empty or errored, so a measured zero and a failed call stop looking identical. That distinction is the single highest-value change in the whole integration layer.
A second one, smaller but more annoying: a Google API key restricted to PageSpeed Insights returns 403 on the Chrome UX Report History API, which is a separate product with separate enablement.
Rather than provision a second key, we read the field data out of the loadingExperience block PSI already returns, which is the same CrUX data at a single point in time instead of a series. Trend direction reports insufficient data until snapshots accumulate week over week, and that is the honest state to show rather than a trend drawn through one point.
The most expensive one came from Cloudflare, and we caused it ourselves. Cloudflare's Early Hints setting makes the edge fire background probe subrequests at the origin, logged under synthetic user agents. Early Hints does nothing unless the origin sends a preload link header, and none of ours do, so the probes never completed and landed in zone analytics as 504s with an origin response status of zero, while real visitors were served normally.
That inflated the error rate feeding the analysis and generated "your origin is failing" findings for sites with a 0.00 percent real error rate. On one site Cloudflare showed 12.77 percent 5xx for a month while the origin's own access log held zero.
Three lessons, in the order they became obvious. Origin access logs are the tiebreaker, and an edge-versus-origin disagreement that large is a measurement artifact rather than an outage.
Segment edge analytics by user agent before believing any error rate, because probe traffic and real errors are identical in the aggregate and the tell is that probe agents produce only 5xx and 404, never a 2xx.
And the finding had already been shipped to eight domains, five of which had been carrying scores two to seven points below what their real state earned, for weeks, because a metric artifact became the headline finding and each cycle's score followed it down.
One more, because it is the same shape and it is the one people building rank tracking will hit. A coverage-state field we tested as "not allowed" returned three values rather than two, and the third was the "not determined" state every uncrawled URL gets. Fifteen uncrawled URLs became "blocked by robots.txt" on a site blocking nothing.
Enumerate the enum. Never test an API field for inequality against one value you happen to have seen.
Bing has its own version of the trap. Its query and page reports send an average click position of -1 on every row with no clicks, which is Bing's way of saying "not applicable". Store that as a number and every unclicked query ranks better than first place. We now store any position at or below zero as null.
GA4 fails the other way: it shows you nothing. It collects every event parameter a site sends, but it reports on none of them until each one is registered as a custom dimension, and registration is not retroactive. Anything that arrived before then can never be broken down. Ask for an unregistered parameter and you get a hard "not a valid dimension" error instead of an empty result, which is at least honest. Registering the parameters our sites send is now a setup step on every new property, done before anyone asks for the report.
What does the crawler side look like?
Nothing like the tools report, and this is the integration we would build first if we started again. Search Console tells you about Googlebot. It says nothing about the agents that increasingly decide what an AI assistant says about you, and the only place those show up is your own edge logs.
Reading Cloudflare's GraphQL analytics across 14 properties over the seven complete days from 4 to 10 August 2026, we counted 74,236 requests carrying a known crawler user agent. The full agent-by-agent table is published in the twenty-week benchmark, with requests, served, 403 and 404 for each of them.
The finding that changes how you build the feature: most traffic carrying an AI-crawler user agent is not that crawler. Split by path rather than by rate, and on one property 1,171 of 1,180 requests claiming to be Applebot were credential probes asking for files the site has never published, things like /.env and /.ssh/id_rsa. Nine asked for a real page and all nine were served.
A refusal rate computed over that denominator says a site is blocking AI crawlers when it is blocking a scanner wearing their name.
So if you build a crawler-access feature, group by user agent, path and verified-bot category together, and never report a rate without the per-path split behind it.
A rate on its own is not a finding. It took us two full investigations to learn that, and the second one only settled it because it added the verified-bot dimension the first had left out.
The portfolio-level ratio has the same trap. On the total, one AI fetcher made 18,871 requests against Googlebot's 5,998, which reads as a 3.1-to-1 headline.
Per property that ratio collapses to a median where Googlebot made about twice as many requests, because a single high-traffic reference site contributed 14,499 of the 18,871. Aggregate ratios across a portfolio of unequal sites are almost always one site.
Which integrations were not worth it?
Backlinks, and the answer is a data problem rather than an API problem. Once the Bing fetch was fixed, eight of nine active domains returned a real, measured zero, and the ninth returned 16 links across four pages. Open PageRank corroborated it: no scored value for any domain and global ranks in the tens of millions.
There was nothing to analyze, so we did not build decay tracking, referring-domain rollups, anchor-text profiles or competitor gap analysis, all of which were on the plan.
Bing's per-link endpoint is worth a specific warning: it answers with an error code for every site URL format we tried, including the one Bing itself reports as registered, and it does so inside an HTTP 200 response.
An API that returns 200 with an error in the body will defeat any client that checks status codes only. Treat that endpoint as unusable rather than as evidence a site has no anchors.
What we built instead is the part worth copying. You cannot manufacture backlinks safely, but internal links are the same class of signal and you own every one of them, so the effort went into routing internal link equity toward pages sitting just outside the top ten.
The counting has its own trap, though, and it inverts the answer if you miss it: a navigation link counts as inbound from every page you crawled, so raw counts said every page was well connected while pages with no editorial links at all sat at position six.
Count distinct linking pages, and treat any target linked from more than half the crawl as navigation rather than as a signal.
What would you build differently starting today?
Three things, in order of how much they would have saved.
Record fetch status next to every stored metric, from the first commit. Not a log line, a column. Almost every expensive bug in this system was an unmeasured value wearing a zero's clothes, and the ones that survived longest were the ones where a downstream consumer had a perfectly reasonable rule like "hide the section when the count is zero."
Anchor every window to the latest date that actually has data, never to the current clock. Search Console lands two to three days late and GA4 about one, so a report generated on a Friday comparing a calendar week to date against a full prior week is comparing four days to seven. That produced customer-facing drops of 72 percent on a site whose traffic was up 42 percent.
Each source has to anchor to its own latest date, because they lag by different amounts.
Treat every third-party number as a claim with a provenance, not a fact. The habit that catches the rest is boring and it works: before acting on a figure, ask which system produced it, over what window, and what it would look like if the pipeline were broken instead.
In this system, the artifacts and the real findings were never distinguishable by how confident they looked.
None of this is an argument against building it. The integration layer is a few thousand lines and it runs unattended every week across 17 domains at zero recurring data cost, which is not a thing you can buy.
It is an argument for spending your first week on the seam between the API and your database rather than on the feature, because that seam is where the lies get in. If that shape of build is one you are weighing, it is the kind of thing we take on a handful of times a year.
Methodology, and reusing these figures
Every figure on this page was read from the running system rather than recalled. The PageSpeed timings were measured from production on 21 August 2026 with the application's own four-category query. The crawler counts come from Cloudflare's httpRequestsAdaptiveGroups GraphQL dataset across 14 properties over the seven complete days from 4 to 10 August 2026, grouped by user agent, request path and edge response status, and they are published with their full agent-by-agent breakdown in the twenty-week benchmark. The Search Console figures behind the verification-horizon example are from a single client domain, unnamed, read from the Search Analytics API on 14 August 2026. The backlink counts are from Bing Webmaster Tools and Open PageRank, read on 2 August 2026 across nine active domains. Integration counts are current as of 25 August 2026.
Two limits worth stating. This is one system's experience across one portfolio, so a failure mode we hit may be specific to how we call an endpoint rather than to the endpoint. And every one of these APIs is versioned and actively changed by its owner, so a behavior described here is dated to the reading, not permanent.
You may republish these figures with attribution and a link to https://concept211.com/articles/seo-data-apis-in-production/. Every heading and every figure above carries a stable id, so you can link to a single number rather than the whole page.
Cite this page
Concept211. “Every SEO data API we wired into production, and which ones are actually usable.” Published 25 August 2026, updated 25 September 2026. https://concept211.com/articles/seo-data-apis-in-production/
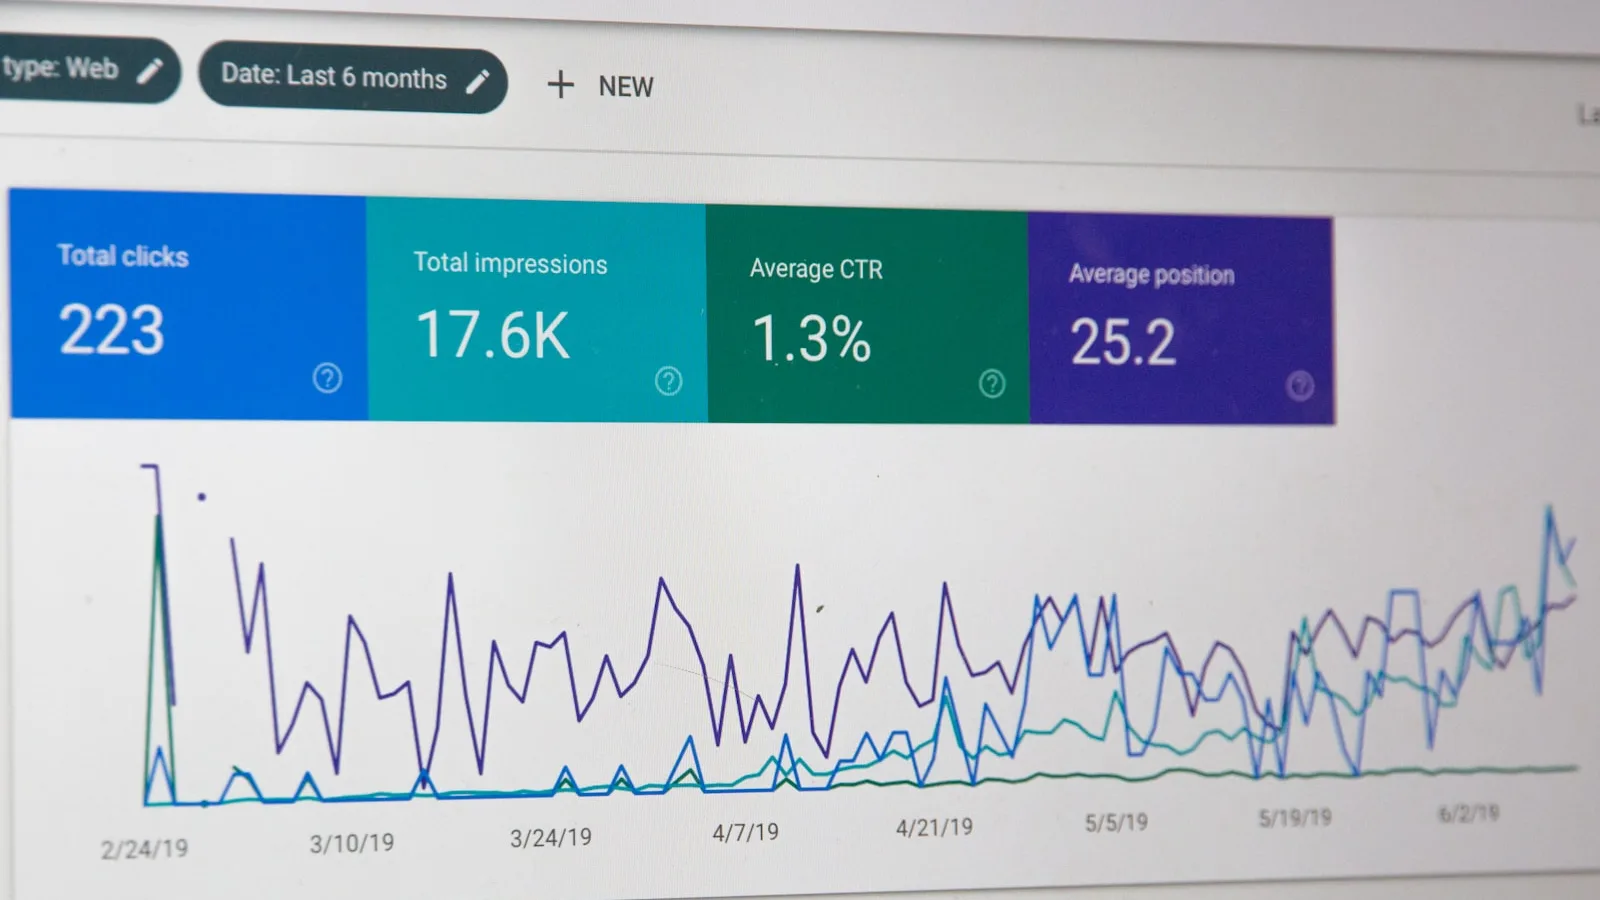
Photo by Stephen Phillips - Hostreviews.co.uk on Unsplash. Illustrative, and not a screenshot of any figure on this page.
Is your data pipeline telling you the truth?
A weekly job that reads six APIs and writes a number somebody acts on is the shape of build we take on. The first conversation is usually about what happens when one of those APIs is quietly wrong.