
20 weeks of AI-search audits, measured.
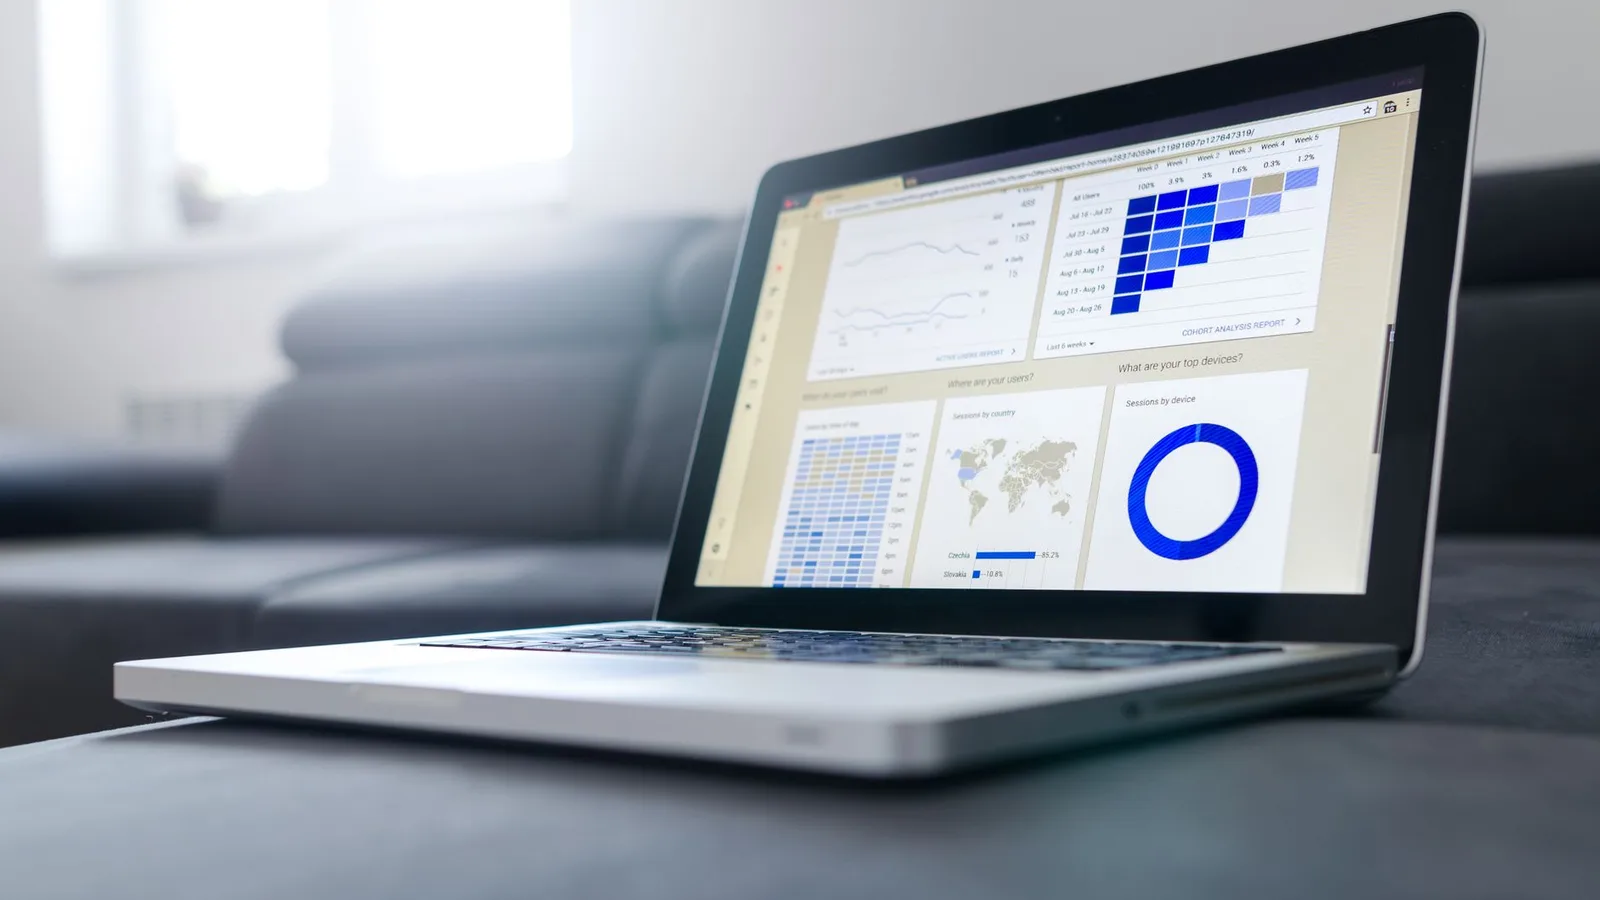
Between 8 March and 28 July 2026, we ran a weekly automated SEO and GEO audit across eight live websites and implemented 1,683 of the fixes it produced. This is what that dataset looks like, including the parts that came back flat. The headline finding is the boring one: the technical preconditions for AI citation were solved uniformly and early across every site, so after week one they explain none of the difference between them, and the work that kept accumulating for 20 weeks was content and internal linking instead.
What exactly was measured, and how?
Every site in this dataset runs on ConceptSEO, a platform we built and operate ourselves. Once a week it runs seven analyses against each connected domain: Technical SEO, Image Audit, PageSpeed Review, Schema Audit, Content Strategy, Internal Linking, and GEO Analysis. Each analysis reads live data from Google Search Console, PageSpeed Insights, Cloudflare, and GA4, then writes individual recommendations. Which of those SEO data APIs survived production is written up separately, including the ones that return something that looks like data and is not. Every recommendation is one row with a category, a source analysis, a status, and a timestamp.
The counts below come from that ledger, queried on 28 July 2026. They are counts of work implemented, not of work suggested, so a recommendation only appears here once the change actually shipped and was verified against the live URL. The crawler measurements later in this article were taken separately with plain HTTP requests on 28 July 2026 and can be reproduced with curl in about a minute.
Eight sites is a small sample and they are not a random one. Two are our own products, one is our own marketing site, one is the platform's own site, and the rest are client sites we chose to take on. Sites are anonymized throughout and no client is named.
How much work does a weekly AI-search cadence actually generate?
Over 20 weeks, 1,683 recommendations were implemented and closed across the eight sites. 1,642 of those, or 97.6 percent, were implemented end to end by the agent rather than by a person editing code by hand.
The per-site spread is wide. Ordered by volume and stripped of names, the eight sites closed 614, 399, 280, 208, 52, 51, 50, and 29 recommendations, which is 36.5, 23.7, 16.6, 12.4, 3.1, 3.0, 3.0 and 1.7 percent of the total. The top two sites absorbed 60.2 percent of all the work; the bottom four together took 10.8 percent. Most of that gap is tenure: the two largest numbers belong to the two sites connected in March, and the four smallest belong to sites connected in late June or July. Normalizing for how long each site has been connected narrows it but does not close it, giving a range of roughly 9 to 31 implemented fixes per site per week.
The result we did not expect is that the rate does not decay. The two sites with 20 weeks of history are still producing at the top of that range, not the bottom. A weekly audit on a mature site does not work through a fixed backlog and go quiet. Site size is a confound here and we cannot separate it cleanly with eight sites, so read this as an observation rather than a law.
Where does the work concentrate?
Grouped by the analysis that produced them, the 1,683 implemented recommendations break down like this. The share column is each row against the 1,683 total.
| Analysis | Implemented | Share of all work |
|---|---|---|
| Content Strategy | 430 | 25.5% |
| Internal Linking | 261 | 15.5% |
| GEO Analysis | 223 | 13.3% |
| Technical SEO | 220 | 13.1% |
| Schema Audit | 172 | 10.2% |
| Image Audit | 142 | 8.4% |
| PageSpeed Review | 139 | 8.3% |
| Local SEO | 29 | 1.7% |
| Weekly Review | 16 | 1.0% |
| Unlabelled (predates the source field) | 51 | 3.0% |
What did not vary at all?
This is the part worth publishing even though it makes for a dull chart. Three measurements came back identical across all eight sites, which means none of them can explain any difference in outcome within this portfolio.
Fetching each homepage as GPTBot, ClaudeBot, PerplexityBot, and Google-Extended returned HTTP 200 on 32 of 32 requests, a 100 percent pass rate with zero variance. 8 of 8 sites publish a reachable llms.txt, again 100 percent. All eight serve a real H1 and between 1,027 and 2,260 words of body text in the raw HTML to GPTBot, with a median around 1,300 — a 2.2x spread between the thinnest and the fullest, and none of them a client-rendered shell.
Crawler access, llms.txt, and server-rendered content are the three levers most commonly written up as the way to get cited. In a portfolio where they were fixed early, they are preconditions with zero variance rather than differentiators. If you are choosing what to work on and your pages already pass those three checks, the honest answer from this dataset is that repeating them will not move anything, and the volume sits in content and internal linking.
Why do some pages get mentioned in AI responses?
In this portfolio, not because of the technical checklist. Crawler access, llms.txt, and server-rendered HTML passed on 100 percent of the sample with zero variance across all eight sites, so none of the three can explain why one page gets quoted and another does not. What kept generating work for 20 weeks was content and internal linking, 41.0 percent of everything implemented.
Read that as a boundary rather than an answer. This dataset can say which levers stopped differentiating once they were solved; it cannot say which of the remaining ones causes a mention, because there is no control group here and no citation-share series behind it. If you want the mechanism itself rather than the measurement, the six levers that decide a citation are written up separately.
Who is actually crawling, and how much of it is real?
Separate measurement, and a later one. Over the seven complete days from 4 to 10 August 2026 we read Cloudflare's edge analytics for 14 properties we operate or manage and counted every request carrying a known crawler user agent: 74,236 requests. One property had no measurable edge traffic in the window and is excluded from the per-property figures below, leaving 13. This is not a survey of published allow-lists. It is what arrived at the edge.
The first thing in the data is not a ranking. It is that a user-agent string is not identity.
| User agent | Requests | Served | 403 | 404 | 403s on paths no site publishes |
|---|---|---|---|---|---|
| ChatGPT-User | 18,871 | 17,712 | 534 | 583 | 299 |
| bingbot | 13,789 | 12,705 | 21 | 307 | 9 |
| Meta-ExternalAgent | 11,546 | 11,294 | 1 | 232 | 0 |
| Applebot | 6,096 | 3,711 | 1,777 | 558 | 1,327 |
| Googlebot | 5,998 | 5,775 | 48 | 152 | 25 |
| ClaudeBot | 5,050 | 4,257 | 196 | 255 | 112 |
| Bytespider | 3,602 | 2,466 | 1,127 | 2 | 0 |
| OAI-SearchBot | 2,115 | 1,663 | 204 | 242 | 100 |
| Amazonbot | 1,843 | 1,087 | 405 | 347 | 182 |
| PerplexityBot | 1,745 | 1,114 | 410 | 218 | 100 |
| CCBot | 1,152 | 586 | 469 | 65 | 302 |
| GPTBot | 1,101 | 659 | 203 | 233 | 122 |
| Amzn-SearchBot | 895 | 219 | 351 | 317 | 191 |
| Google-Extended | 433 | 113 | 150 | 170 | 78 |
How much of this traffic is a crawler pretending?
Enough to ruin any refusal rate computed from the raw totals. Applebot shows 1,777 refusals, and 1,327 of them landed on paths none of these sites has ever published: /production/.env, /key.pem, /.ssh/id_rsa, /.git/config, /telescope/requests. Real Applebot does not ask for a private key. We audited one property path by path, our own site, and the split was total: of 1,180 requests carrying the Applebot string, 1,171 were credential probes and 9 asked for a real page, all 9 of which were served. On the same property PerplexityBot and Google-Extended made 98 requests between them and not one was for a page that exists.
So a per-crawler refusal rate read off a log is close to meaningless unless the denominator is filtered by path first. The version of that number people publish, ours included until we checked, mostly measures how attractive a target the site is to credential scanners borrowing a respectable name.
The last column is a pattern match against credential files and framework debug endpoints, not a full audit of 14 properties. The unclassified remainder mixes paths a site refuses on purpose with paths we have not inspected, so treat that column as a floor on spoofing rather than a total.
Does an AI fetcher out-crawl Googlebot?
On the portfolio total, yes, and the total is misleading. ChatGPT-User made 18,871 requests against Googlebot's 5,998, a ratio of 3.1 to 1. Per property that ratio collapses. Across the 13 properties with traffic it runs 9.9, 5.8, 1.5, 1.3, 0.9, 0.9, 0.5, 0.4, 0.4, 0.4, 0.2, 0.2 and 0.1, so the median property saw Googlebot make twice as many requests as ChatGPT-User. The portfolio figure is one property: a single high-traffic reference site contributed 14,499 of the 18,871.
ChatGPT-User is worth separating from the training crawlers anyway, because it only fetches when a person has just asked an assistant something. Whatever it costs to serve, it is the closest thing in this table to a reader. Its 534 refusals across the window are the ones we would actually chase, and 299 of those were probes.
Two smaller results, both against expectation. Meta-ExternalAgent was the third-heaviest agent at 11,546 requests and was refused exactly once, and it is concentrated: four properties account for roughly three quarters of it. Google-Extended, the token that gets argued about most in robots.txt drafting, made 433 requests in seven days across 6 properties, and 113 of them were served. It is the loudest debate about the quietest crawler in the dataset.
What this does not show: seven days is a short window, 14 properties is a small and non-random sample, and none of this says anything about whether being crawled leads to being cited. It is a description of who knocked.
Did the weekly cadence produce steady output?
No, and the shape is not subtle. By the month a recommendation was closed:
| Month | Implemented | Share of the 20 weeks |
|---|---|---|
| March 2026 | 400 | 23.8% |
| April 2026 | 118 | 7.0% |
| May 2026 | 490 | 29.1% |
| June 2026 | 150 | 8.9% |
| July 2026 | 525 | 31.2% |
The two quietest months, April and June, carry 15.9 percent of the work between them. May and July carry 60.3 percent. So an active month runs about four times a quiet one, on an audit schedule that never varied.
The analyses ran on schedule every week. What varied was the implementation, which is operator-driven and lumpy. Two of the three quiet months are the months where nobody sat down and worked the queue. Anyone reading this while pricing a subscription analysis tool should note that the audit cadence and the fix cadence are separate problems, and only the first of them is solved by software running on a timer.
What does this tell you about commissioning AI-search work?
Less than we would like, and here is what we would actually stand behind.
The technical GEO checklist is real but small. Crawler access, server-rendered HTML, schema, snippet caps, and llms.txt are worth doing and they are mostly a one-time cost. If a proposal is priced as ongoing work and its substance is that list, you are being sold a project as a retainer.
The recurring cost is content and internal linking. That is where 41 percent of the implemented work landed and it is the part that kept producing new items 20 weeks in. It is also the part that needs judgment, which is why it is the expensive half. If you want that half run rather than reported, it is the technical GEO service behind this benchmark, and this page is the record of what it produced.
Generating recommendations is easy and implementing them is not. 1,683 of the 1,831 recommendations generated were implemented, a 91.9 percent implementation rate, and that number looks that way only because implementation was automated: 97.6 percent of the closed work was shipped by the agent rather than by a person editing code. An audit that produces 200 items for a team with no engineering time produces nothing.
What this does not show
The most important limitation is that this is not a causal study of AI citation. ConceptSEO does record which engines cited which pages for which prompts, but we are not publishing a citation-share series here, because a citation count is only as meaningful as the prompt set behind it and we have not yet run a prompt set stable enough across 20 weeks to make a before-and-after claim we would defend. Anyone quoting this article should quote it as a record of what was measured and implemented, not as evidence that a given category of change causes citations.
Beyond that: eight sites is small, they are not randomly selected, they span very different sizes and sectors, and the window is 20 weeks rather than a year. There is no control group, so nothing here separates the effect of the work from everything else that happened to these sites over the same period. The month-by-month figures reflect our own working habits as much as they reflect the sites.
The measurement window on this page closes 28 July 2026. We will republish with a longer window rather than quietly leaving these numbers to age, and if the citation-share series becomes solid enough to stand behind, that will be its own article.
If you want the method rather than the numbers, the GEO checklist we run is written up in full, and GEO vs traditional SEO covers what changes when you optimize for AI search at all.
Methodology, and reusing these figures
Every count on this page was read from the ConceptSEO recommendation ledger on 28 July 2026: one database row per recommendation, carrying a category, a source analysis, a status, and a timestamp. The window runs 8 March to 28 July 2026 across eight connected domains. Percentages are each figure against the 1,683 implemented total, except the 91.9 percent implementation rate, which is 1,683 against the 1,831 generated. The crawler-access and word-count checks in the zero-variance section were taken separately with plain HTTP requests on 28 July 2026. Nothing here is modeled, sampled, or estimated.
The crawler-volume section is a different dataset with a different window and should be cited as one. It comes from Cloudflare's edge analytics, queried one UTC day at a time for the seven complete days from 4 to 10 August 2026 and read on 11 August 2026, grouped by user agent, edge response status and request path, and scoped per hostname. It covers 14 properties, 11 of them ours and 3 client sites, which is a larger and later set than the eight in the ledger above. Requests are counted at the edge, so a request Cloudflare refused is counted even though it never reached an origin. The spoofing column is a pattern match against credential files and framework debug endpoints; one property was additionally audited path by path. Client properties are aggregated and unnamed.
You may republish these figures with attribution and a link to https://concept211.com/articles/ai-search-audit-benchmark-20-weeks/. Every section heading and headline figure carries a stable id, so you can link to one number rather than the whole page.
Quoting a figure? Cite this page
Concept211. “What 20 weeks of weekly AI-search audits across 8 sites produced.” Published 28 July 2026, updated 1 September 2026. https://concept211.com/articles/ai-search-audit-benchmark-20-weeks/
Want this cadence run on your own site?
Weekly audits, the fixes merged rather than listed, and the measurements kept so you can check the claims yourself. It is our technical SEO and GEO service, and we take on about five client builds a year.
Photo by Lukas Blazek on Pexels
All articles